Is AI Graph Maker worth using? Check that the chart tells you the denominator
Compare AI Graph Maker with built-in spreadsheet charts using two synthetic support queues. Measure not just how fast bars appear but whether counts, rates and sample sizes survive export.
AI Graph Maker is worth a trial if you need a one-off editable chart from a public or synthetic table. Its official guide describes manual entry and spreadsheet inputs such as Excel, with editable labels and titles. For a weekly metric whose data is already in the same spreadsheet, try the built-in chart first. Switching tools adds copying, reconciliation and snapshot maintenance.
Test a sample whose ranking reverses
Imagine a weekly support report with two fictional queues. A has four reopened tickets out of 20 originally closed; B has twelve out of 200. B has the higher count, while A has the higher rate, 20% versus 6%. Use counts to ask where there is more reopen work, rates with denominators to ask where a ticket is more likely to reopen. Start both bar axes at zero. Do not pass counts off as rates or place incompatible units on one axis. The original illustration uses invented data, not tool output.
Use the same follow-up window for both rates, such as seven days after closure. The reversal does not explain its cause, especially with A's small denominator.
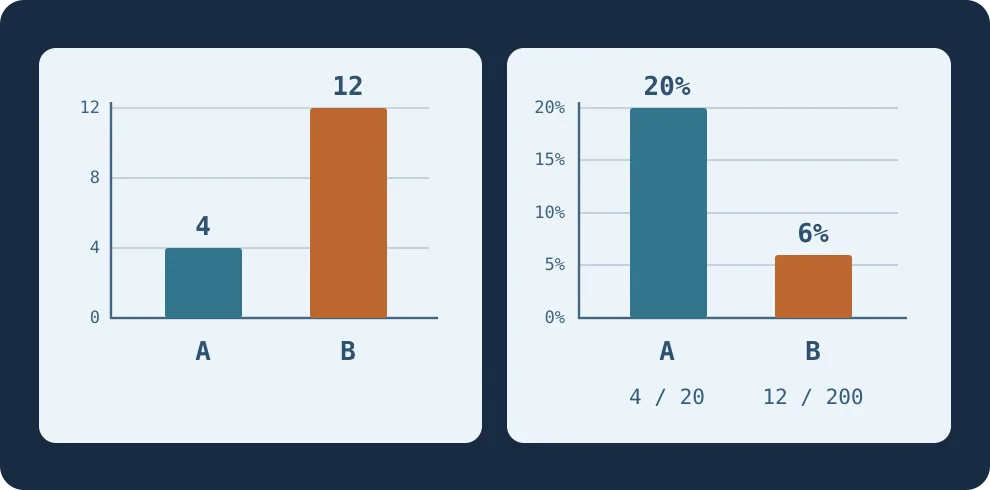
Figure 1. Counts help staff a queue. To compare how often tickets reopen, show the rates and their separate denominators.
Ask someone who has not seen the input to read the export
Make both versions from the same synthetic table: one in AI Graph Maker and one in your spreadsheet. Include denominators, time window and rate definition in the handoff. Ask a colleague who hasn't seen the input to read only the export and tell you which queue has more reopenings, which has the higher rate and each denominator. Values available only on hover are not visible in a PNG. Repeat with a second data set and check how fast you can update the chart after changing the table. Include calculation, labeling, exporting and reconciliation time.
Adopt only if the reader gets both rounds right, the chart remains editable and delivery is faster. If key labels disappear on export, data must be pasted repeatedly, or the report must refresh automatically, keep the spreadsheet or existing reporting system. Confirm export format, quotas and sharing visibility for the entry point and plan before team use.
Content note:This article is based on publicly available information and is intended as a reference for evaluating tools. Features, pricing, and related policies may change at any time; please refer to the latest official information.
Original source:aigraphmaker.net