Akkio: Can a chat-generated conversion chart go in the weekly report?
Use two channels with very different volumes to test the combined rate and its denominator.
Akkio’s January 2024 release describes generating bar and line charts in Chat Explore. It can draft a first look at new data. If the same metric goes to the same readers every week, put the definition and formula in a reviewed template first. The right chart type does not establish the correct denominator or filters.
Test two different denominators
Invent two channels: A has 10 visits and five target actions, or 50%; B has 100 and 20, or 20%. The combined conversion rate per visit is 25/110≈22.7%, not the unweighted mean of 35%. Keep group denominators visible and label totals as visit-weighted, with the same reporting week. Add a third channel with zero visits: the total stays the same, and that channel shows no data, not 0%.
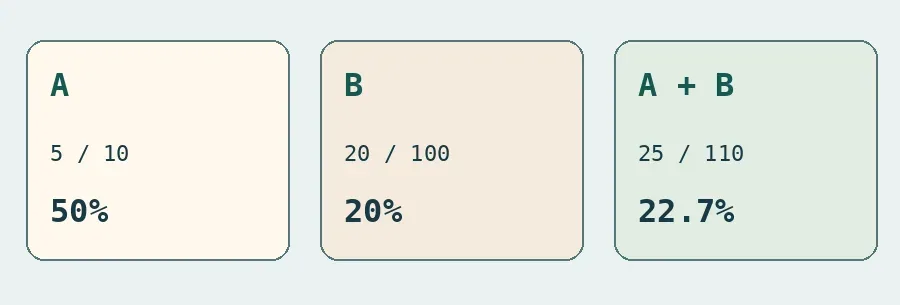
Original denominator diagram, not Akkio output. 35% gives both channels equal weight and answers a different question.
Include review time
Calculate the expected answer on paper first and compare the draft, legend, filters and traceable calculation. Use an exploration chart if a reviewer can recover both 25 and 110 and explain the empty channel. Any mismatch keeps it out of the weekly report. If checking takes longer than the template, keep the template and save conversational charts for one-off questions.
Content note:This article is based on publicly available information and is intended as a reference for evaluating tools. Features, pricing, and related policies may change at any time; please refer to the latest official information.
Original source:www.akkio.com