Is Atera worth adopting for patch planning? Turn device percentages into a device-by-device list
Atera’s device completion percentage, missing patches and scan times can help IT teams prepare maintenance plans, but none substitutes for the others. Before adopting it, reconcile scope, offline status and individual tasks using the same fictional devices, and include export gaps and review time in the cost.
IT teams maintaining devices across several offices often have no shortage of “updated” percentages. What they lack is a device-by-device maintenance list that an owner can verify. Atera brings device status, missing patches and site information into one management interface, making it a candidate for teams that regularly combine these records. If an existing list already works reliably, a more attractive percentage chart does not justify migration. First establish whether the platform reduces reconciliation work, rather than treating a summary as proof that maintenance is complete.
Atera’s official Patch Management Dashboard documentation distinguishes two views: whether each device is fully updated, and which devices are missing each patch. The completion percentage counts devices, not missing patches. The device list also includes online or offline availability, the last patch scan and pending restarts. For a buyer, the value lies in explaining which device needs what and how recent the information is, rather than merely displaying an overall score.
Consider a completely fictional paper sample of six devices, D1 through D6. No missing items are recorded for D1 through D4; D5 is missing P and Q, while D6 is missing only Q. In this sample, 4/6 devices are complete, approximately 66.7%. Two devices need attention, but there are three device–patch pairs: D5–P, D5–Q and D6–Q. P and Q are placeholder labels, not real patches. Treating two devices as two tasks would omit one pair; treating three tasks as three devices would misstate coverage. This constructed example explains the counting method. It is not an Atera test.
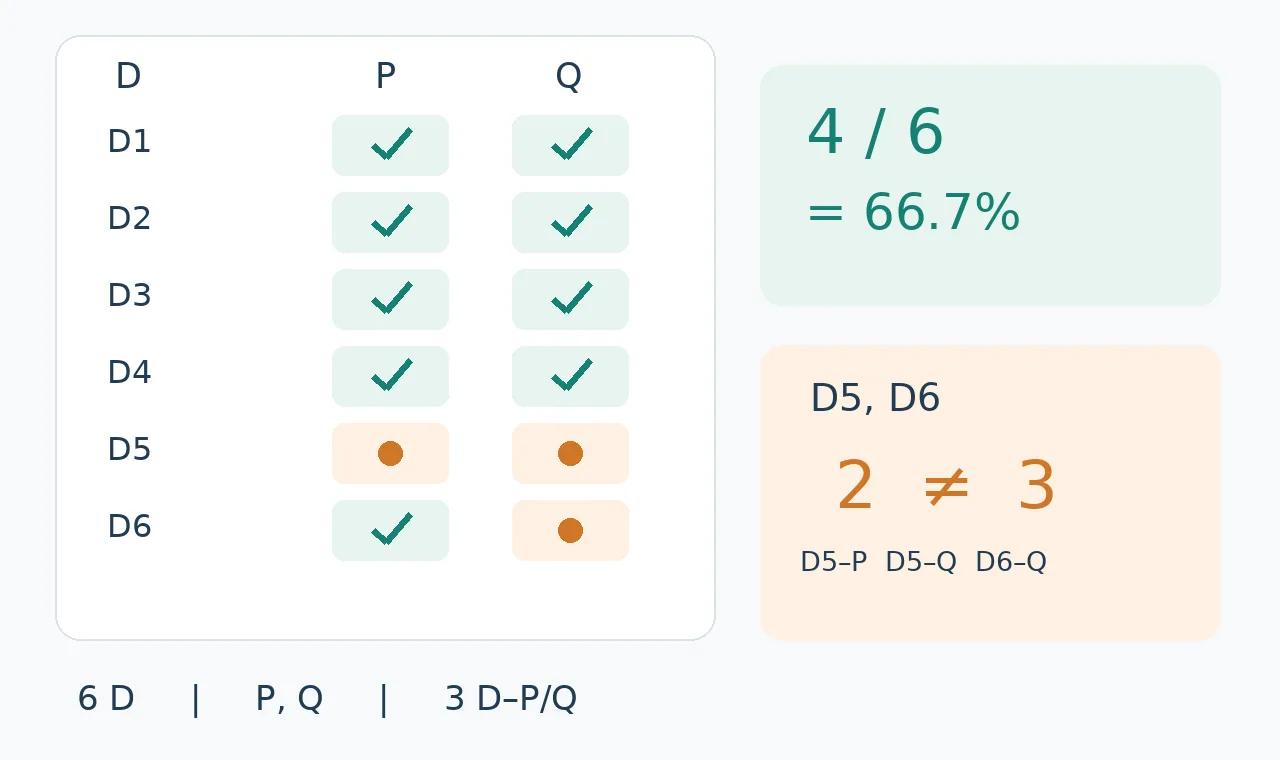
Original paper illustration, not a product interface or test result. Green checks mean no missing item is recorded in the sample; orange dots mean an item is missing. The records classify four of six devices as fully updated, or 66.7%. Two devices requiring attention correspond to three device–patch tasks. The figure does not show data freshness; each device’s scan time and online status still need checking.
The list also needs information timestamps. Suppose D4 is currently offline and its last scan is from an earlier time. “No missing items were recorded then” cannot automatically become “fully updated and verified now.” The documentation says patch information for online devices is updated hourly and provides a last-scan time. That frequency does not create new evidence for offline devices and is not a real-time guarantee. A procurement demonstration should explain the sample’s denominator, known gaps and devices requiring confirmation together. Keep an explicit “needs verification” marker for stale entries instead of quietly counting them as accepted in the current review.
Ask the vendor for a demonstration list containing no real device, user or network information, or reconcile a paper simulation row by row. Are the six device identifiers unique? Can sites and owners be matched? Are both items for D5 and the one for D6 retained? Are D4’s timestamp and offline state conspicuous? Views must cover the same scope: showing fewer sites could also improve a completion percentage. This acceptance exercise checks presentation and information completeness only. It requires no endpoint connection, agent installation, commands, remote access, reboot or patch execution. Actual changes still require the organization’s own approval process.
Test the export separately. The official documentation says the device list can be exported to Excel, but AI and Available patches data are excluded. A workbook that opens successfully is therefore not necessarily a complete device-by-device patch plan. Ask the vendor to use fictional records to explain where the missing patch relationships will come from, how they will be linked to device identifiers and who will review them. This guide does not assume that another report or API will necessarily fill the gap. If someone still has to assemble the details device by device, include that work in the comparison.
A reproducible cost comparison can start with working time. Suppose the old process takes 50 minutes per cycle to combine records. The new process needs 12 minutes to prepare the export, 18 to fill in the device–patch relationships, and 15 to review offline entries and hand over the list: 45 minutes in total, a net saving of five. At four cycles per month, that is 20 minutes, not the 152 minutes obtained by counting only 50−12 each time. These are budgeting assumptions, excluding the actual maintenance time required by both options. Obtain a written quote specifying the required administration seats, site and operating-system scope, permissions and reports, and add migration, training and continuing review costs. Do not assume that AI features or a particular report are included in the plan you intend to buy.
Atera deserves a place on the shortlist if repetitive cross-site reconciliation is genuinely the main burden and the same sample can be traced from the device percentage to a complete device-by-device list. Conversely, with few devices, infrequent maintenance, or an existing spreadsheet that clearly records owners, status timestamps and tasks, staying with that system may be better value. The useful procurement output is a consistently scoped maintenance list with identifiable data age and an owner for every item, plus the time it actually takes to produce it. The overview percentage is only the starting point.
Content note:This article is based on publicly available information and is intended as a reference for evaluating tools. Features, pricing, and related policies may change at any time; please refer to the latest official information.
Original source:web.archive.org