ChatCSV buying guide: when a chart says quantity, ask what it counted
Three fictional exhibit records distinguish counting rows from adding units to check whether a chart answers the question.
If you get a chart by asking a table a question, compare ChatCSV on whether the chart makes the calculation clear. Flatfile’s October 2023 acquisition announcement says ChatCSV answers questions about tabular data and displays charts; the ChatCSV site also lists visualization. Showing a conclusion does not mean using the aggregation you asked for.
Write three fictional exhibit-label records on paper: blue, 2 units; blue, 3 units; gray, 1 unit. When asked for units by color, the answer is blue 5 and gray 1. For the number of rows, it is blue 2 and gray 1. Show the reader an imaginary chart labeled only Quantity. Ask whether it counts rows or adds units, and check it against the three records. Do not rely on the chart if the measure is unclear. No upload, account, or real data is used.
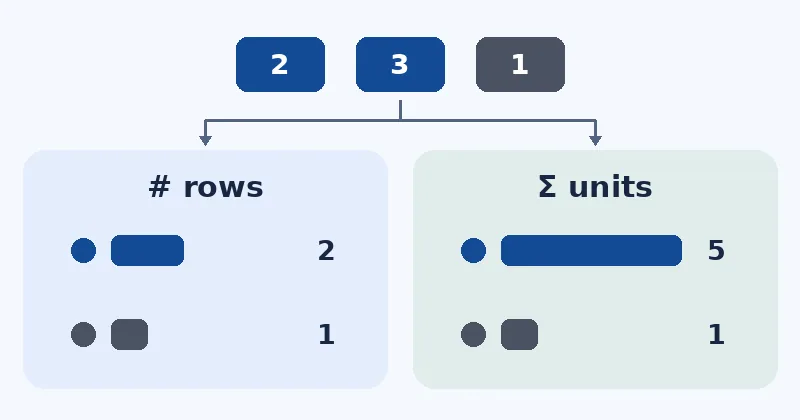
If three rows suffice to calculate by hand, use paper or a local summary first. Evaluate ChatCSV only if you often move between charts and questions and can verify columns, grouping, and calculation on a small example. Polished charts cannot substitute for reproducible numbers.
Content note:This article is based on publicly available information and is intended as a reference for evaluating tools. Features, pricing, and related policies may change at any time; please refer to the latest official information.
Original source:flatfile.com