Dashi Metrics buying guide: Do two visible dots mean there are only two on the sphere?
Compare the dot count in one view of a fictional paper sphere with the full list. What you cannot see is not necessarily missing.
For an overview, consider comparing the globe-style presentation described by Dashi Metrics with a flat list. In its August 4, 2026 launch introduction, the maker says the product shows events on a rotatable 3D globe. The example here borrows only that presentation idea. It does not use real locations, visitors, revenue, or transactions, and it does not establish that the product displays every event or explains why any event occurred.
Three dots on one paper sphere, not all on the same side
Draw an imaginary paper sphere and use N, S, and F as IDs, not as directions, countries, or people. Put N and S on the front and F on the back. Make a separate list that includes all three IDs. Show the front to someone who has not seen the list. They should say “I can see two dots right now,” not “there are two dots in total.” Then show the reverse so they can identify F. Finally, show only the front and an incomplete list containing N and S. The reader should say the total is unverified, not conclude that F does not exist.
Now copy F onto a second drawing of the front but keep the original dot on the back. Adding the counts from both views would count F twice. Match the IDs before counting: there are three dots, not four just because one was drawn twice. The example concerns limited views and occlusion. It describes no real events and is neither a Dashi Metrics interface nor a product output.
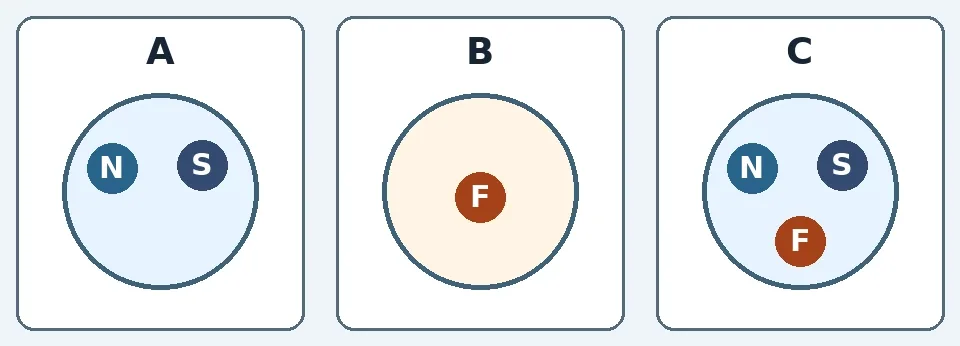
A and B are opposite sides of the same fictional paper sphere. C shows three dots, but when C and B are read together, the two copies of F still count as one. This is not a map or a product screen.
Is the goal to walk readers through a layout or count everything at once?
If the goal is only to check the total or find missing entries, put the independent list first. If you often have to explain spatial relationships, compare the spherical view with an ordinary table and allow for the time needed to change views, check the list, and resolve repeated IDs. Keep the visual only if it makes the layout easier to understand and readers can return to the complete list. An empty-looking view does not mean a record is absent. The entire example is fictional and on paper: no account, tracking, real data analysis, real-world location, external sending, or product use.
Content note:This article is based on publicly available information and is intended as a reference for evaluating tools. Features, pricing, and related policies may change at any time; please refer to the latest official information.
Original source:www.producthunt.com