Dynatrace buying guide: equal averages can conceal two very long strips
Two piles of paper separate average and distribution. To see a tail, check whether the source preserves usable bucket counts.
The July 9, 2025 histogram documentation for Dynatrace explains that buckets count observations in ranges and let the product estimate percentiles. The document distinguishes formats that do or do not keep those buckets. Ask whether you need only the overall average or also a long tail. If grouping is not preserved, the average cannot reconstruct the distribution.
Draw two fictional stacks of graph-paper strips. Stack A has eight two-cell strips. B has six one-cell strips and two five-cell strips. Each totals 16 and averages two cells; the counts above two cells are zero and two respectively. Give someone each total and a grouped table with ranges. The totals cannot settle which has longer strips. A count for “above two” can. Conversely, two broad ranges called “short” and “long” cannot recover the precise length of each strip. No actual percentile is calculated; this is not a product screenshot.
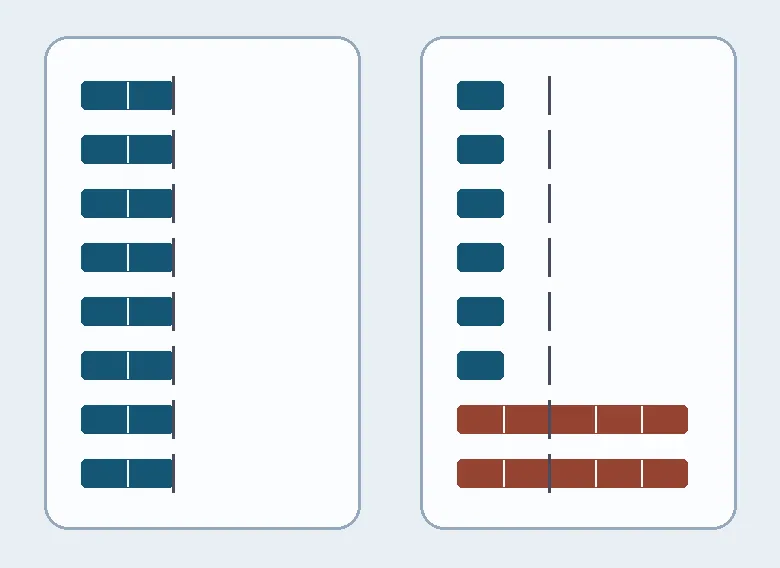
At left, eight strips are at or below two and none above. At right, six are at or below and two above. The line is a threshold, not a percentile.
If you only need total and average, a simple summary avoids retaining buckets. If rare long values change your decision, check whether inputs preserve buckets, whether ranges match the decision threshold, and what estimation error means. An existing group table you can hand to another reader makes a manual baseline. This is fictional paper only: no collectors, hosts, traffic or personal information.
Content note:This article is based on publicly available information and is intended as a reference for evaluating tools. Features, pricing, and related policies may change at any time; please refer to the latest official information.
Original source:www.dynatrace.com