Growth Opt Playbook buying guide: CPA rose. Check the channel mix or channel costs first?
Use two comparable reporting periods to separate changing conversion mix from rising channel costs and decide when to use Growth Opt Playbook’s Change drivers.
When blended CPA goes from 20 to 25.4, someone in the review is bound to say, “We need new ads.” Hold off. If a relatively expensive channel accounts for more conversions, blended CPA can rise even when that channel's cost per conversion is unchanged. Growth Opt Playbook’s Change drivers can narrow the investigation if you have two periods broken out by channel on the same basis. If you only have a top-line report, or need to know how many additional conversions the next budget increment will generate, don’t use the breakdown to make that call.
The Change drivers methodology lists date, ad spend, a breakdown dimension and conversions. It weights mix by each channel’s share of conversions, not share of ad spend. Align the conversion event, attribution window and currency across periods, and remove duplicate total rows. Overall CPA or per-channel unit costs alone cannot tell you which channel weights changed; retrieve the underlying counts first.
Check it with two channels and a known answer
Here is a fictional calculation, not a tool test or actual ad spend. Each period has 100 like-for-like conversions. In the first, channel A delivers 80 at 16 each and B delivers 20 at 36 each, for a blended CPA of 20. In the second, A and B deliver 60 and 40. Hold both unit costs at the earlier values and blended CPA reaches 24 already. If B also rises to 39.5 per conversion while A stays flat, the observed total works out to 25.4. All three calculations have a denominator of 100 conversions.
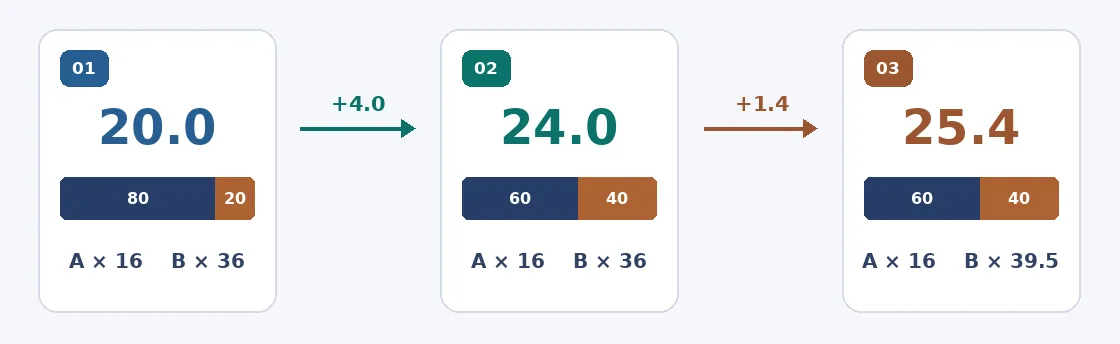
Original fictional calculation, not a screenshot. The middle value of 24 uses the earlier channel costs as a reference; it is not another amount spent.
To evaluate the product, you can use a synthetic CSV without customer records. Check that the actual period totals reconcile to 20 and 25.4, and that the output separates mix from channel cost and lets you trace each back to a channel. The value of 24 is a manual reference based on a chosen order; the tool may allocate the interaction differently. Recalculate the two CPA levels as 20 and 25.4. The components should add up to the change of 5.4, not to either period’s CPA. If the underlying figures don’t add up, resolve definitions or row granularity in a spreadsheet before presenting a chart as a budget explanation.
The vendor’s CPA diagnosis guide separates mix shifts from within-channel efficiency changes and recommends checking measurement and reporting first. In the example, ask first why B accounted for more conversions, then investigate why its own cost rose. The breakdown cannot prove a change was due to creative, bidding or seasonality. Use a separate controlled test to estimate the incremental effect of more spending. The vendor says submitted data is processed in the browser; a synthetic file also lets you evaluate this without changing any ad accounts.
Content note:This article is based on publicly available information and is intended as a reference for evaluating tools. Features, pricing, and related policies may change at any time; please refer to the latest official information.
Original source:growthoptplaybook.com